The Auditory Modeling Toolbox
Go to function
demo_lopezpoveda2001 - Widening of filters in the lopezpoveda2001
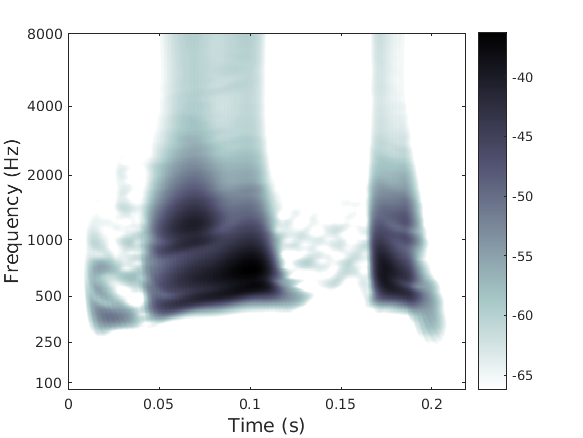
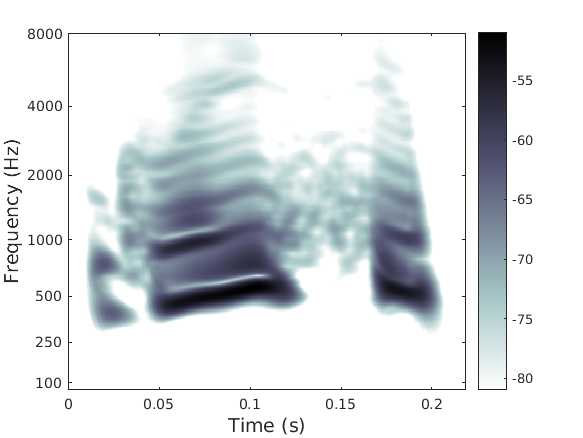
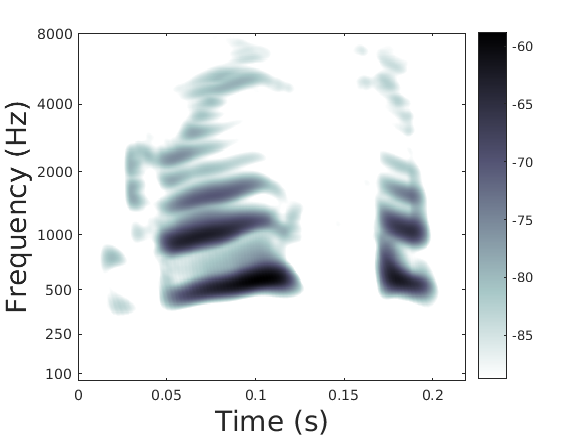
This script displays three auditory spectrograms generated using the lopezpoveda2001. The input signal is the same, just presented at three different levels. The purpose is to visualize the broading of the auditory filters at higher input levels.

Greasy at 50 dB
This figure shows the lopezpoveda2001 of an input speech signal with a level
of 50 dB SPL.

Greasy at 70 dB
This figure shows the lopezpoveda2001 of an input speech signal with a level
of 50 dB SPL.

Greasy at 90 dB
This figure shows the lopezpoveda2001 of an input speech signal with a level
of 50 dB SPL.


