The Auditory Modeling Toolbox
EXP_BREEBAART2001 - Figures from Breebaart et al.(2001a and 2001b)
Usage
output = exp_breebaart2001(flags)
exp_breebaart2001(flags) reproduces experiments from the Breebaart et al (2001a and 2001b) papers.
The following flags can be specified;
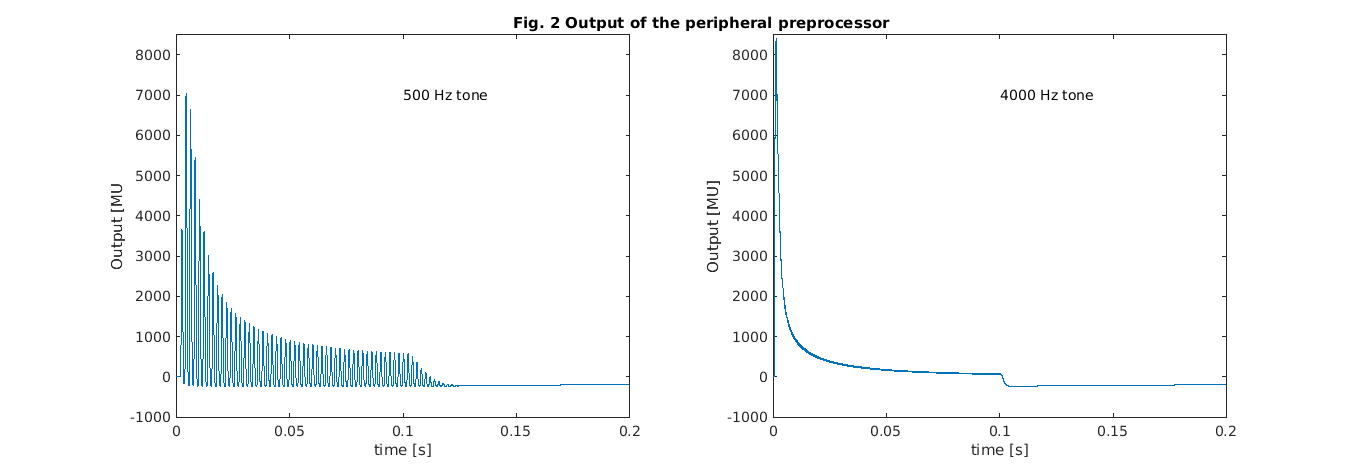
| 'a_fig2' | Reproduce Fig. 2 from Breebaart et al. (2001a): Output of the peripheral preprocessor for a 500-Hz tone (left panel) and a 4000-Hz tone(right panel) of 100-ms duration. The output is caluculated for a filter which is nearest to the frequency of the tone. |
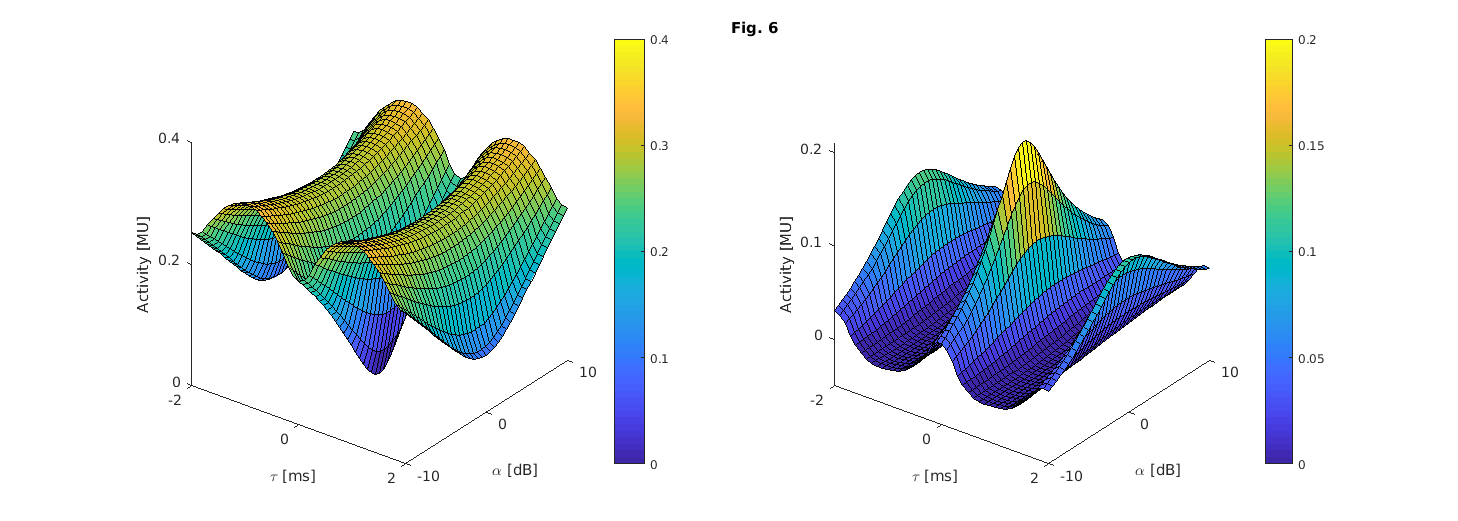
| 'a_fig6' | Reproduce Fig. 6 from Breebaart et al. (2001a): Left panel: Idealized EI-activity for a wideband diotic noise (0-4000 Hz) with an overall level of 70 dB SPL (offset = default = 100 dB) for an auditory filter which is nearest to the frequency of the tone. Right panel: change in the activity pattern of the left pannel if a 500-Hz interaurally ou-of-phase signal (Spi) is added with a level of 50 dB (offset = default = 100 dB). Both signal and master have a duration of 1 second and the figures show the mean output of the first 100 ms. |
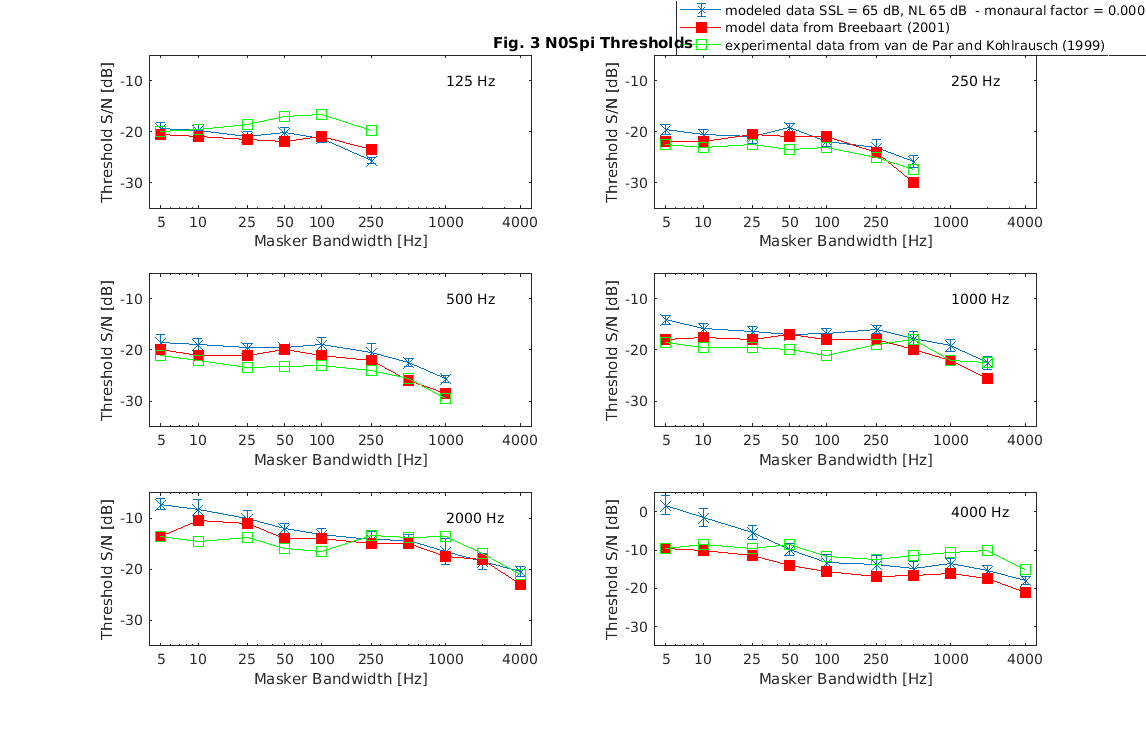
| 'b_fig3' | Reproduce Fig. 3 from Breebaart et al. (2001b): N0Spi thresholds as a function of the masker bandwidth for a constant overall level of the masker. The six panels represent center frequencies of 125, 250, 500, 1000, 2000 and 4000 Hz, respectivly. The filled squares are model predictions from Breebaart et al. (2001b). The stars are model predictions calculated with our implementation of the Breebaart model for a combination of binaural and monaural decisions. The open squares are data adapted from van de Par and Kohlrausch (1999). |
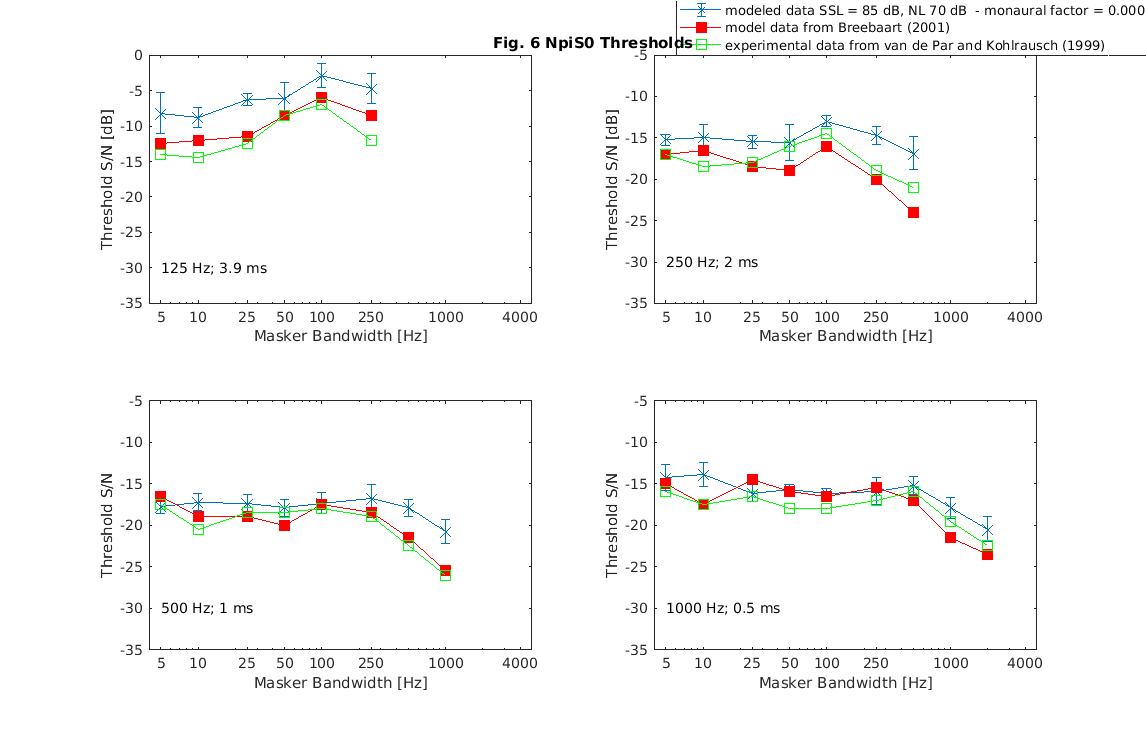
| 'b_fig6' | Reproduce Fig. 6 from Breebaart et al. (2001b): NpiSo thresholds as a function of masker bandwidth for 125-Hz (upper-left panel), 250-Hz (upper-right-panel), 500-Hz (lower left panel), and 1000-Hz center frequency (lower-right panel). The open sybols are data adapted from van de Par and Kohlrausch (1999), the filled symbols are model preictions from Breebaart et al. (2001b) and the stars are model predicitons calculated with out implementation of the Breebaart model for a combination of binaural and monaural decisions. |
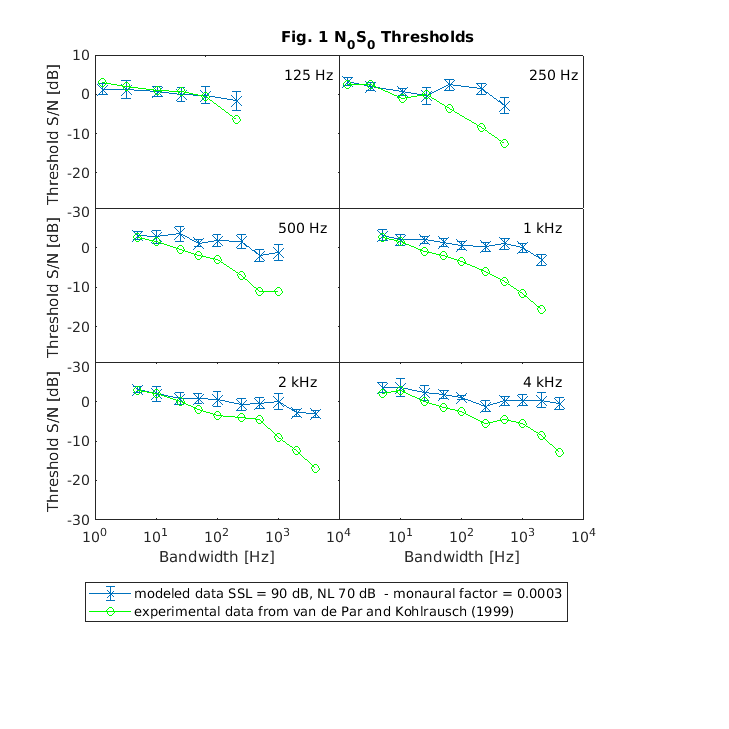
| 'fig1_vandepar1999' | Reproduce Fig.1 from van de Par and Kohlrausch for the N0S0 condition: N0S0 thresholds as a fuction of the masker bandwidth expressed in signal-to-overall-noise power ratio. The six panels show data at various center frequencies. The circels are experimental data and the stars are model predicitions calculated with our implemntation ot the Breebaart model using the monaural decision. |
Further, cache flags (see amt_cache) and plot flags can be specified:
| 'plot' | Plot the output of the experiment. This is the default. |
| 'noplot' | Don't plot, only return data. |
Figure 3 of Breebaart et al. (2001b) can also be calculated using the interface of the model initiative. Assuming a model interface waiting for binaural signals in a directory DIR, use exp_breebaart2001('b_fig3','redo','ModelInitiative','directory',DIR);. The AMT will start the experiment, collect the responses from the model server, and plot the figure.
Example:
To display Figure 2 of Breebaart et al. (2001a) use
out = exp_breebaart2001('a_fig2');
To display Figure 6 of Breebaart et al. (2001a) use
out = exp_breebaart2001('a_fig6');
To display Figure 3 of Breebaart et al. (2001b) use
out = exp_breebaart2001('b_fig3');
To display Figure 6 of Breebaart et al. (2001b) use
out = exp_breebaart2001('b_fig6');
To display Figure 1 of van de Par and Kohlrausch (1999) use
out = exp_breebaart2001('fig1_vandepar1999');
References:
J. Breebaart, S. van de Par, and A. Kohlrausch. Binaural processing model based on contralateral inhibition. I. Model structure. J. Acoust. Soc. Am., 110:1074--1088, August 2001.
J. Breebaart, S. van de Par, and A. Kohlrausch. Binaural processing model based on contralateral inhibition. II. Dependence on spectral parameters. J. Acoust. Soc. Am., 110:1089--1104, August 2001.
S. van de Par and A. Kohlrausch. Dependence of binaural masking level differences on center frequency, masker bandwidth, and interaural parameters. J. Acoust. Soc. Am., 106(4):1940--1947, 1999.


