The Auditory Modeling Toolbox
Go to function
EXP_DIETZ2011 - Experiments from Dietz et al. 2011
Description
exp_dietz2011(fig) reproduce Fig. no. fig from the Dietz et al. 2011 paper.
Note: The input signals used in this routine are not identical to the ones used in the original paper.
The following flags can be specified;
| 'plot' | Plot the output of the experiment. This is the default. |
| 'noplot' | Don't plot, only return data. |
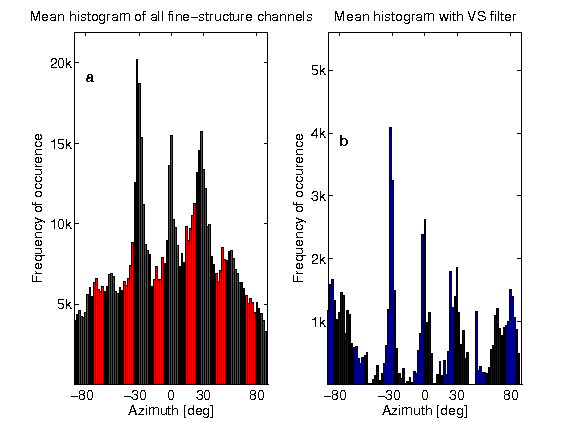
| 'fig3' | Reproduce Fig. 3 panels a + b. |
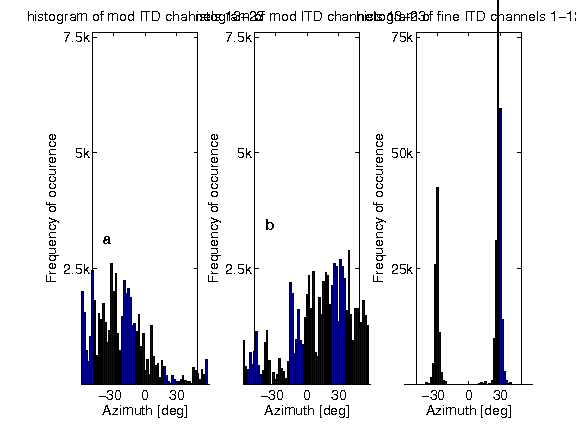
| 'fig4' | Reproduce Fig. 4. |
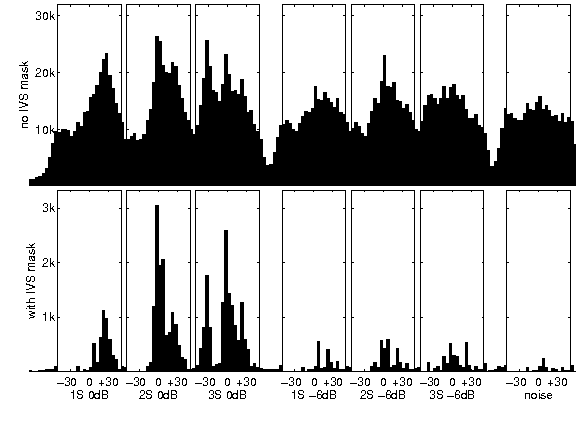
| 'fig5' | Reproduce Fig. 5. |
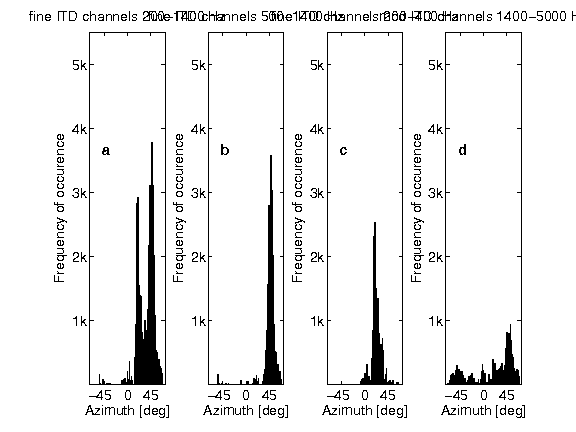
| 'fig6' | Reproduce Fig. 6. |
| 'fig6_spille2013' | Reproduce Fig. 6 from Spille et al. (2013). |
Examples:
To display Fig. 3 use
exp_dietz2011('fig3');

To display Fig. 4 use
exp_dietz2011('fig4');

To display Fig. 5 use
exp_dietz2011('fig5');

To display Fig. 6 use
exp_dietz2011('fig6');

To display Fig. 6 from Spille et al. (2013) use
exp_dietz2011('fig6_spille2013');
References:
M. Dietz, S. D. Ewert, and V. Hohmann. Auditory model based direction estimation of concurrent speakers from binaural signals. Speech Communication, 53(5):592-605, 2011. [ DOI | http ]
C. Spille, B. Meyer, M. Dietz, and V. Hohmann. Binaural scene analysis with multi-dimensional statistical filters, chapter 6. Springer-Verlag GmbH, 2013.


